One of the challenges while running web automation as a package in a docker container which is orchestrated by Kubernetes is to view and understand what is happening while tests are running. Especially when your tests are executed in a cloud environment like AWS, you need to have a way to see your test logs.
This write-up puts a light on how can it was done by sending logs to Logstash endpoint which is configured to send the logs to Kibana. Following is my setup to run the web automation tests.
- Selenium WebDriver
- TestNG
- Docker
- Kubernetes
- Logstash endpoint.
Add following dependencies to pom.xml
<!-- https://mvnrepository.com/artifact/ch.qos.logback/logback-classic -->
<dependency>
    <groupId>ch.qos.logback</groupId>
    <artifactId>logback-classic</artifactId>
    <version>1.2.3</version>
    <scope>test</scope>
</dependency>

<dependency>
    <groupId>net.logstash.logback</groupId>
    <artifactId>logstash-logback-encoder</artifactId>
    <version>6.3</version>
</dependency>

<!-- https://mvnrepository.com/artifact/ch.qos.logback/logback-core -->
<dependency>
    <groupId>ch.qos.logback</groupId>
    <artifactId>logback-core</artifactId>
    <version>1.2.3</version>
</dependency>

<!-- https://mvnrepository.com/artifact/org.slf4j/slf4j-api -->
<dependency>
    <groupId>org.slf4j</groupId>
    <artifactId>slf4j-api</artifactId>
    <version>1.7.25</version>
</dependency>
Create logback.xml under /src/main/resources
Add the following to logback.xml
<?xml version="1.0" encoding="UTF-8"?>
<configuration scan="true">
    <property scope="context" name="app_name" value="<value_to_indetify_in_kibana>" />
    <appender name="consoleAppender" class="ch.qos.logback.core.ConsoleAppender">
        <filter class="ch.qos.logback.classic.filter.ThresholdFilter">
            <level>${logConsoleLevel:-DEBUG}</level>
        </filter>
        <encoder>
            <Pattern>%d %-4relative [%thread] %-5level %logger{45} - %msg%n</Pattern>
        </encoder>
    </appender>
    <appender name="logstashAppender" class="net.logstash.logback.appender.LogstashTcpSocketAppender">
        <destination>${LOGSTASH_DESTINATION:-localhost}:<Port></destination>
        <ringBufferSize>32768</ringBufferSize>
        <droppedWarnFrequency>1</droppedWarnFrequency>
        <!-- encoder is required -->
        <encoder class="net.logstash.logback.encoder.LogstashEncoder">
            <includeCallerInfo>true</includeCallerInfo>
            <includeContext>true</includeContext>
            <includeMdc>true</includeMdc>
            <charset>UTF-8</charset>
            <Pattern>%d %-4relative [%thread] %-5level %logger{45} - %msg%n</Pattern>
        </encoder>
    </appender>
    <root>
        <level value="ALL"/>
        <appender-ref ref="consoleAppender"/>
        <appender-ref ref="logstashAppender"/>
    </root>
</configuration>
Create a logger instance
public Logger logger = LoggerFactory.getLogger(BaseTest.class);
Use it in the project
public class TestListener extends BaseTest implements ITestListener {


    private static String getTestMethodName(ITestResult iTestResult) {
        return iTestResult.getMethod().getConstructorOrMethod().getName();
    }

    @Override
    public void onStart(ITestContext iTestContext) {
        logger.info("I am in onStart method " + iTestContext.getName());
        iTestContext.setAttribute("WebDriver", driver);
    }

    @Override
    public void onFinish(ITestContext iTestContext) {
        logger.info("I am in onFinish method " + iTestContext.getName());
        //Do tier down operations for extentreports reporting!
        ExtentTestManager.endTest();
        ExtentManager.getReporter().flush();
    }

    @Override
    public void onTestStart(ITestResult iTestResult) {
        logger.info("I am in onTestStart method " + getTestMethodName(iTestResult) + " start");
    }

    @Override
    public void onTestSuccess(ITestResult iTestResult) {
        logger.info("I am in onTestSuccess method " + getTestMethodName(iTestResult) + " succeeded");
        //ExtentReports log operation for passed tests.
        ExtentTestManager.getTest().log(LogStatus.PASS, "Test passed");
    }


    @Override
    public void onTestFailure(ITestResult iTestResult) {

        logger.info("I am in onTestFailure Method " + getTestMethodName(iTestResult) + " failed");


        ExtentTestManager.getTest().log(LogStatus.FAIL, iTestResult.getThrowable().toString());
        String base64Screenshot = "data:image/png;base64," + ((TakesScreenshot) driver).
                getScreenshotAs(OutputType.BASE64);

        ExtentTestManager.getTest().log(LogStatus.FAIL, "Test Failed", ExtentTestManager.getTest().addBase64ScreenShot(base64Screenshot));
    }

    @Override
    public void onTestSkipped(ITestResult iTestResult) {
        logger.info("I am in onTestSkipped method " + getTestMethodName(iTestResult) + " skipped");
        //ExtentReports log operation for skipped tests.
        ExtentTestManager.getTest().log(LogStatus.SKIP, "Test Skipped");

    }

    @Override
    public void onTestFailedButWithinSuccessPercentage(ITestResult iTestResult) {
        logger.info("Test failed but it is in defined success ratio " + getTestMethodName(iTestResult));
    }


}
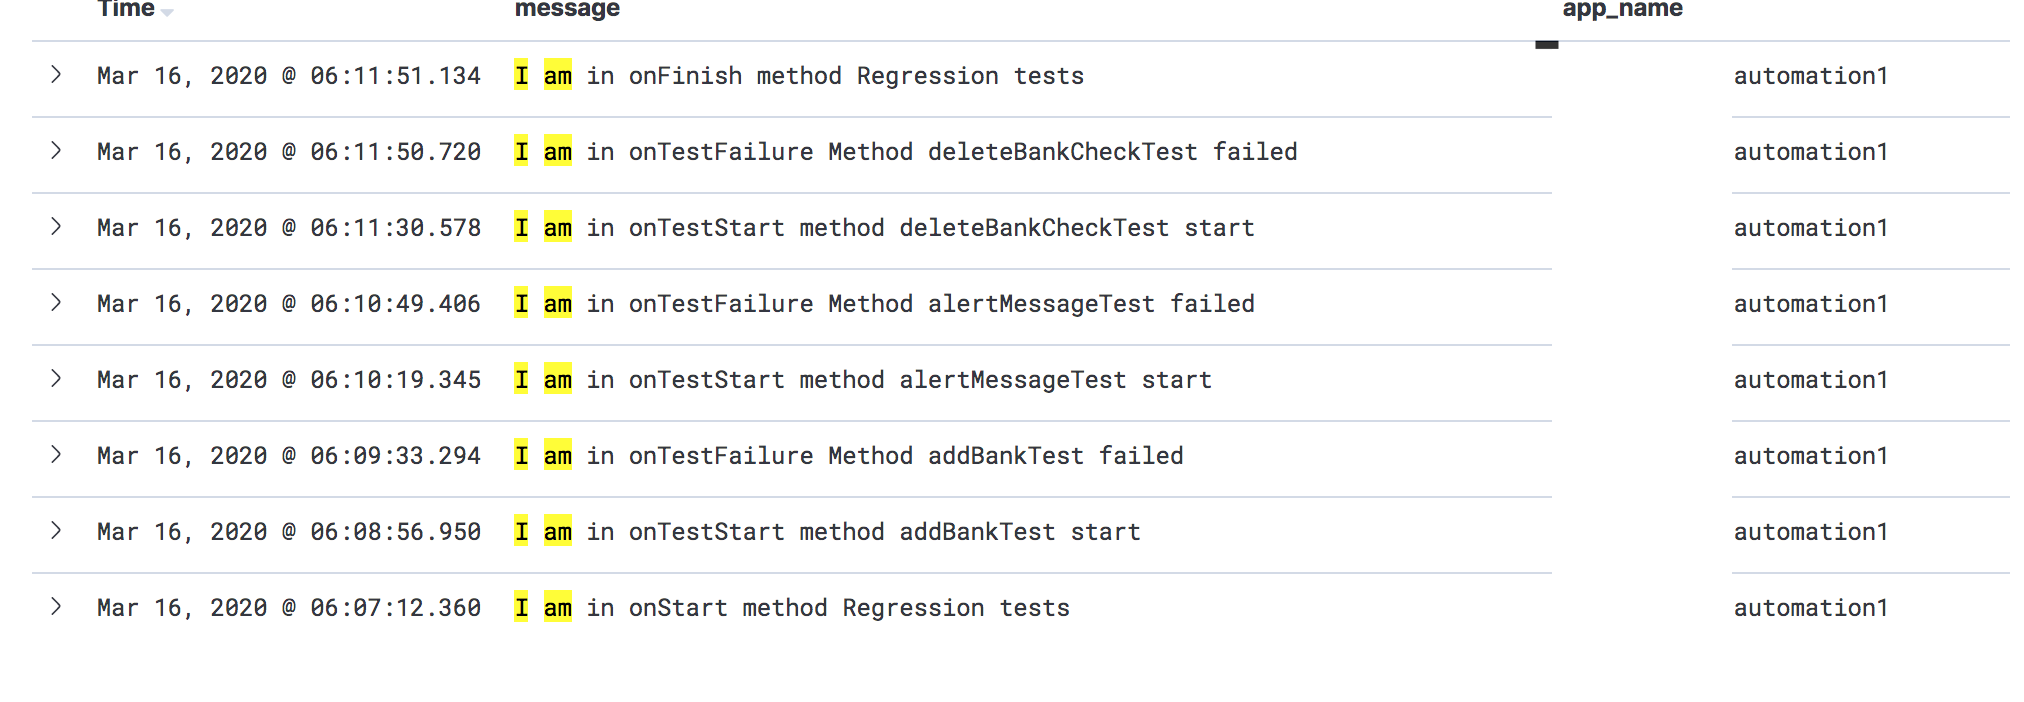
Kibana logs will look like this: